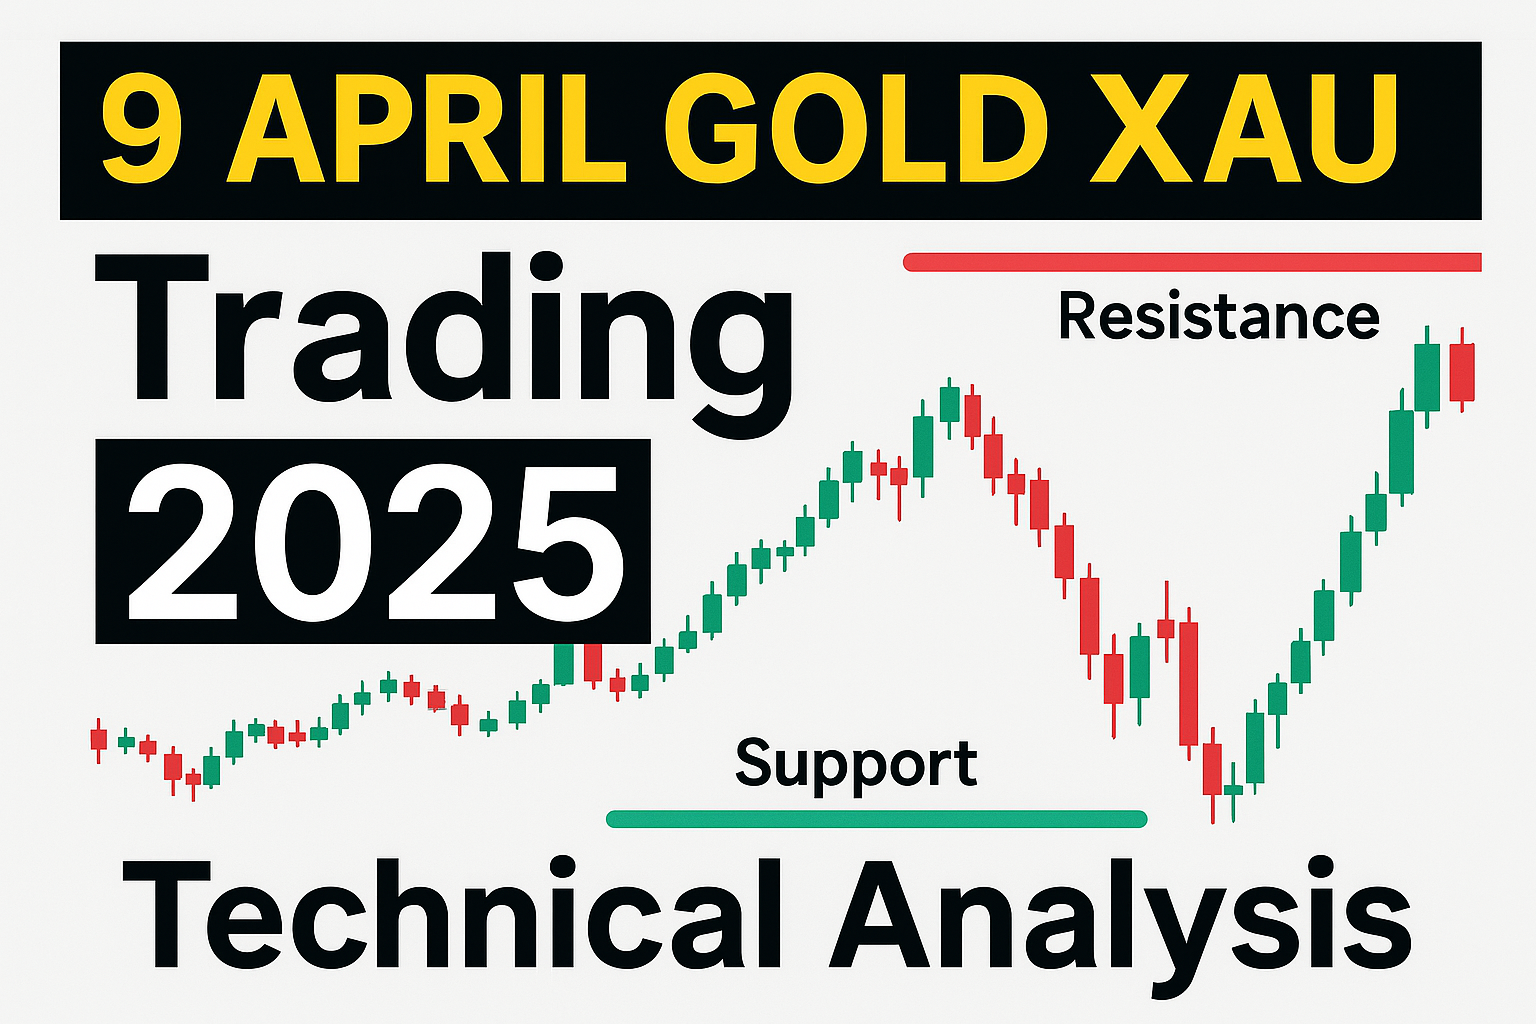
9 APRIL GOLD XAU Trading 2025 | Complete Technical Analysis, Buy & Sell Trade Setups
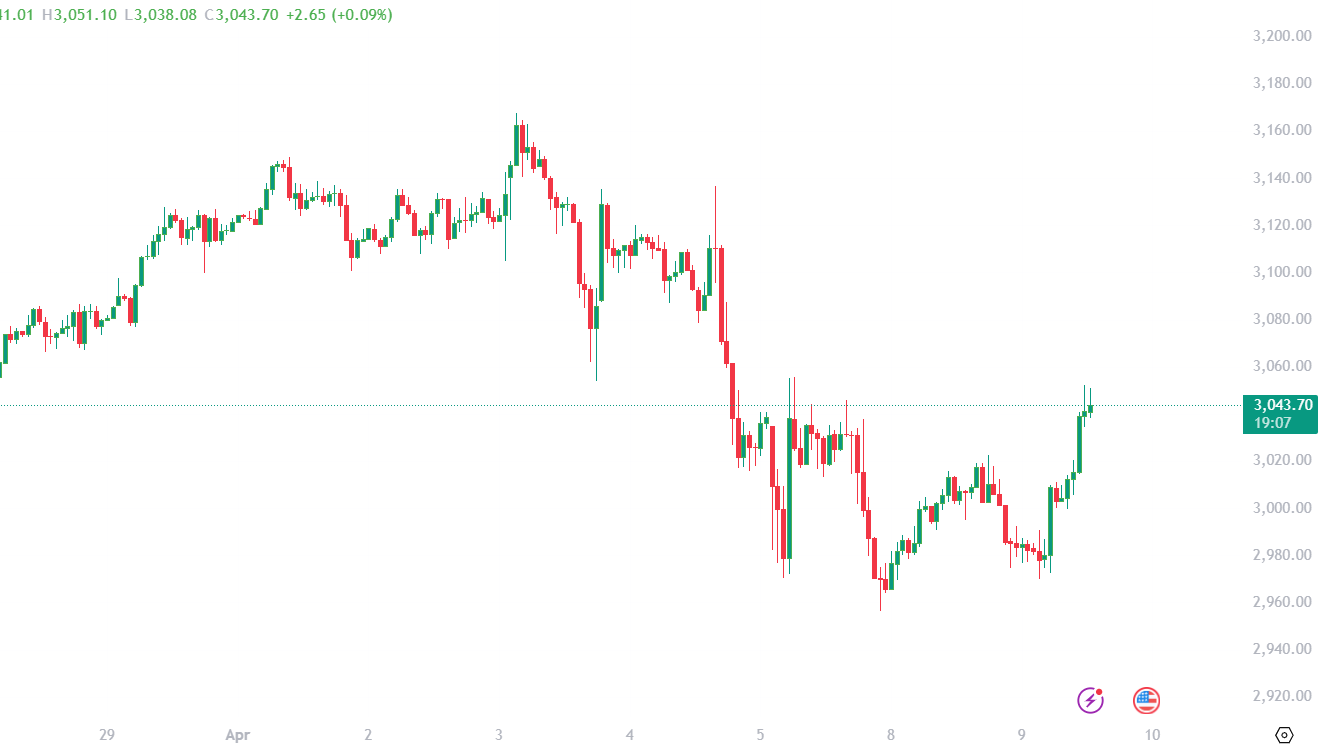
Gold (XAUUSD) has remained one of the most actively traded commodities globally, offering traders numerous high-probability setups. As of 9 April 2025, the price of Gold is trading near $3,043.70, showing a significant recovery from the recent lows near $2,940. The market structure on the 1-hour chart indicates a potential shift in momentum, offering both bullish and bearish trading opportunities.
In this blog, we will perform a complete technical breakdown using support and resistance zones, identify possible trend reversals or continuations, and conclude with 2 high-probability trade setups – a buy and a sell idea – both aligned with a 1:3 risk-reward ratio.
Let’s dive deep into the 9 APRIL GOLD XAU Trading 2025 analysis.
📊 Overall Market Structure
The 1H chart of Gold (XAUUSD) shows a recent sharp decline from the $3,140+ area, followed by consolidation and a bounce from the support near $2,940–$2,960. The price action on April 9th is forming a short-term bullish rally, breaking previous minor resistance levels and approaching a key supply zone near $3,060–$3,080.
Observations:
- Previous Highs: $3,140 and $3,120
- Recent Lows: $2,940
- Current Price: $3,043.70
- Momentum has turned bullish in the short term
- However, price is nearing a key resistance area where sellers could step in again
📌 Key Support and Resistance Zones
Identifying support and resistance levels is crucial for successful execution of trades, especially in a volatile asset like gold. For 9 APRIL GOLD XAU Trading 2025, here are the major zones:
🔻 Support Zones:
- $2,940–$2,960: Strong demand zone; price bounced from here on April 8
- $2,980–$3,000: Recent consolidation zone before breakout
- $3,020: Former resistance turned support
🔺 Resistance Zones:
- $3,060–$3,080: Major supply zone; price reversed from here on April 4–5
- $3,100: Psychological resistance and mid-range level
- $3,120–$3,140: Previous swing high; strong selling pressure observed earlier
🔎 Technical Indicators Overview (Based on Price Action)
While the chart does not show indicators like RSI or Moving Averages, price action alone reveals a lot:
- The current price has broken above short-term consolidation highs.
- Candlestick formations show increasing bullish momentum.
- Volume likely surged during the breakout, indicating strong buying interest.
- Price is now moving into a decision zone where it could either reject resistance or continue the breakout.
This dual nature provides an excellent opportunity to plan both a long and a short trade setup.
📈 BUY TRADE IDEA (Breakout Continuation)
✅ Trade Direction: Long (Buy)
📍 Entry: $3,046 (on retest of minor resistance)
🎯 Take-Profit: $3,090
🛑 Stop-Loss: $3,032
🧮 Risk-Reward Ratio: 1:3
📝 Analysis:
This buy trade is based on the bullish breakout from the consolidation zone around $3,000–$3,030. Price is showing strength and is expected to retest the $3,046 zone before continuing toward the next major resistance near $3,090.
The trade aims to capture the momentum continuation in case bulls remain in control. With proper stop-loss placement below the breakout structure, this setup offers minimal risk and strong reward potential.
📉 SELL TRADE IDEA (Rejection from Resistance)
✅ Trade Direction: Short (Sell)
📍 Entry: $3,078 (around resistance zone)
🎯 Take-Profit: $3,020
🛑 Stop-Loss: $3,094
🧮 Risk-Reward Ratio: 1:3
📝 Analysis:
This trade banks on the assumption that the price will face resistance around $3,060–$3,080, an area where sellers previously dominated. If price rallies into this zone and shows signs of weakness or bearish rejection (e.g., bearish engulfing candle), it becomes a high-probability short setup.
The stop-loss is placed just above the resistance zone to protect against a breakout, while the target lies at the previous minor support around $3,020.
🚨 Risk Management Notes
In both trade setups, proper risk management is key. Never risk more than 1–2% of your trading capital on a single trade. Stick to the trade plan and adjust your lot size based on the stop-loss range.
Also, monitor macroeconomic news such as Fed announcements, NFP data, and geopolitical updates that can impact gold prices.
🌐 SEO Focus: 9 APRIL GOLD XAU Trading 2025
This analysis for 9 APRIL GOLD XAU Trading 2025 is designed to help traders prepare effectively using a data-driven, chart-based approach. Whether you’re trading in the USA, UK, or globally, understanding price action, key levels, and risk-reward strategies can give you a major edge in the gold markets.
Using proper support and resistance, observing market structure, and waiting for confirmations before entry are the most important elements of this strategy.
So whether you’re a swing trader or intraday scalper, the 9 APRIL GOLD XAU Trading 2025 setups above can provide clear opportunities in both directions – long and short.
📌 Final Thoughts
Gold continues to offer volatility and opportunity in 2025. As per our 9 APRIL GOLD XAU Trading 2025 analysis:
- Bullish bias may continue above $3,046, targeting $3,090
- Bearish reversal may occur at $3,078, targeting $3,020
- Both setups offer a 1:3 Risk-to-Reward Ratio
- Zones to watch: $3,060–$3,080 (resistance), $3,000–$3,020 (support)
Use this analysis to sharpen your trade plans and adapt based on price action as it unfolds.
What is the current trend in Gold XAUUSD on 9 April 2025?
Answer: As of 9 April 2025, Gold (XAUUSD) is showing a bullish short-term trend, recovering from the $2,940–$2,960 support zone and trading near $3,043. If it sustains above this level, we may see further upside toward $3,090 and possibly $3,120. However, strong resistance exists around $3,060–$3,080.
2. What are the best trade setups for Gold on 9 APRIL GOLD XAU Trading 2025?
Buy Trade from $3,046 targeting $3,090 with SL at $3,032 (1:3 RR)
Sell Trade from $3,078 targeting $3,020 with SL at $3,094 (1:3 RR)
Which support and resistance levels should traders watch in Gold (XAUUSD) today?
Answer: Key support levels for 9 APRIL GOLD XAU Trading 2025 are $2,940–$2,960, $2,980–$3,000, and $3,020. Resistance levels to watch are $3,060–$3,080 and $3,120–$3,140. These zones are crucial for planning entry and exit in both long and short positions.
Is Gold expected to rise or fall on 9 April 2025?
Answer: Gold is currently showing bullish momentum on 9 April 2025. If price breaks and holds above $3,060, we may see further rise. However, rejection from $3,078–$3,080 resistance could trigger a pullback toward $3,020. Traders should monitor price action near key levels.
How to trade Gold XAUUSD safely on 9 APRIL GOLD XAU Trading 2025?
Answer: Use clear support and resistance zones to define entries and exits. Follow strict risk management, targeting trades with at least 1:2 or 1:3 risk-reward. Avoid trading during high-impact news events. Confirm breakouts or rejections with candlestick patterns.