🚀 9 APRIL BTC Trading 2025 – Bitcoin Price Analysis, Support/Resistance Zones & Trade Setups
As we move through the second week of April 2025, Bitcoin (BTC/USDT) continues to show signs of volatility and active trader participation. The hourly chart reveals key market movements, highlighting a recent recovery attempt following a significant dip. Traders and investors alike are eagerly observing the charts for potential setups that can deliver high risk-reward trades. In this blog, we’ll break down the BTC price action for 9 APRIL BTC Trading 2025, identify crucial support and resistance levels, and present two high-probability trade setups (1 buying opportunity and 1 selling opportunity).

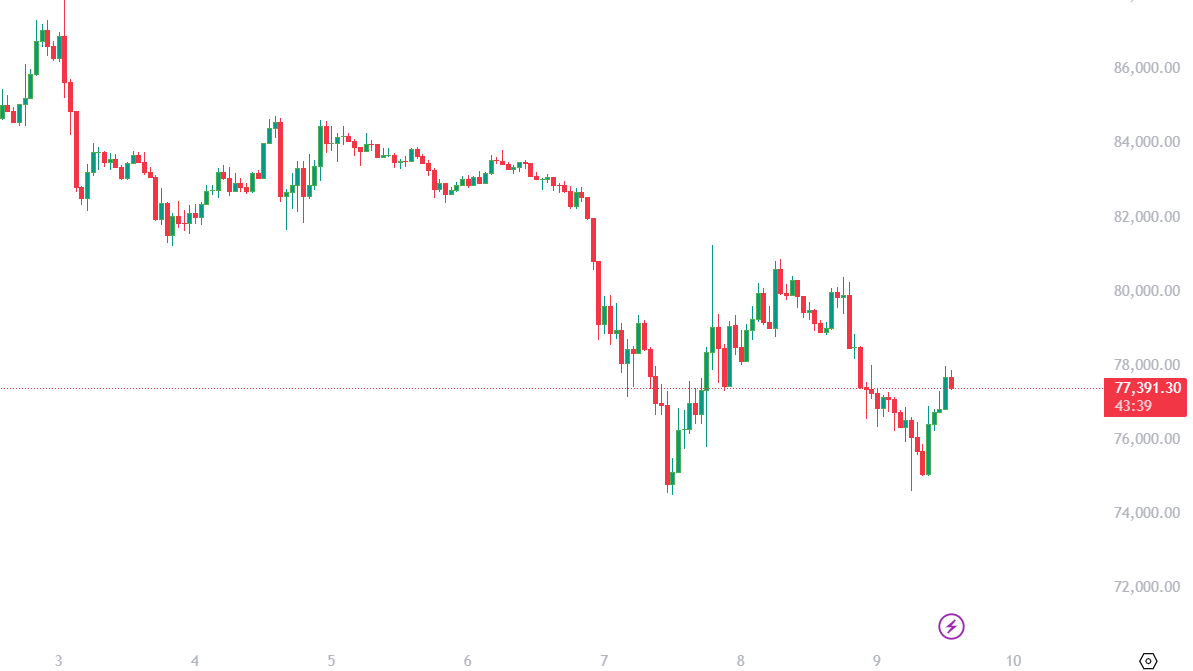
🧠 BTC Price Action Overview – What the Chart Shows
The 1-hour BTC/USDT chart from Binance indicates a sharp sell-off around April 6–7, which drove the price down to nearly $75,000. However, since then, we’ve seen a decent recovery, with BTC forming a short-term higher low and pushing back above $77,000 at the time of writing.
Here are the technical highlights:
- Sharp decline from the $83,000–$84,000 zone.
- A bullish engulfing candle on April 8th near the $75,000 mark suggests buying interest.
- The market is now consolidating between $76,000 and $78,000.
This context helps us identify key levels and trading opportunities for 9 APRIL BTC Trading 2025.
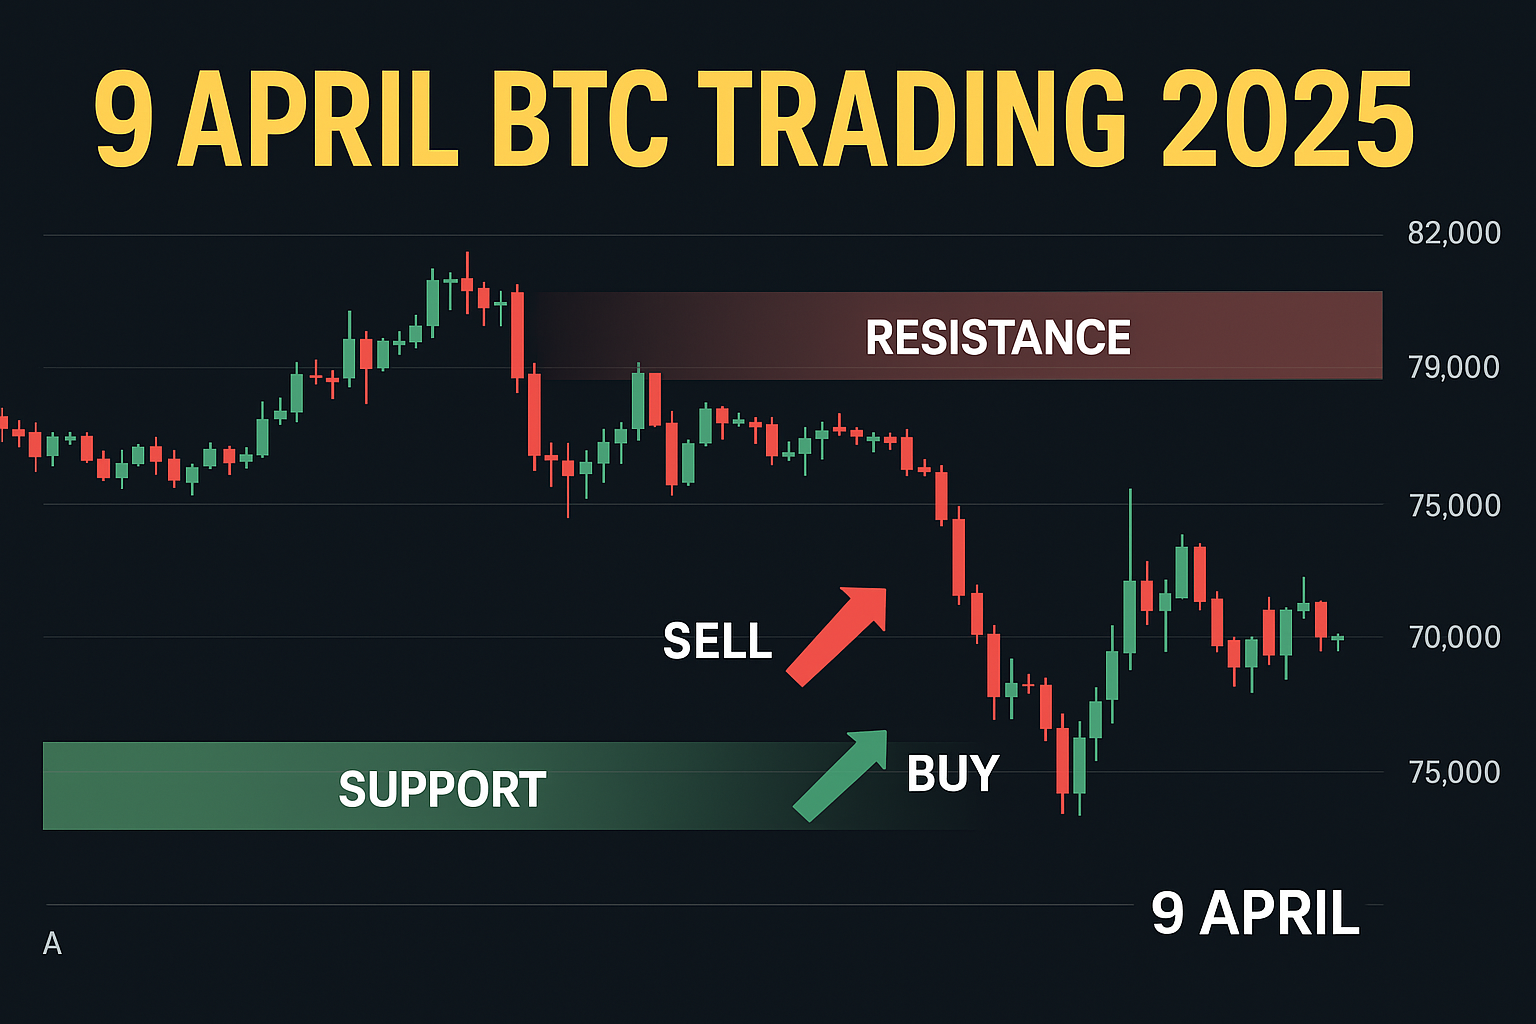
🔍 Key Support and Resistance Zones
Identifying support and resistance is crucial for traders to set clean entries, exits, and stop-losses. Based on the current price action, here are the critical zones:
✅ Support Zones:
- $75,000 – $75,500: Recent bounce zone; price respected this as support on April 8.
- $72,500 – $73,000: Strong psychological and technical support; previous bounce zone from April 3.
🚫 Resistance Zones:
- $78,500 – $79,000: Immediate resistance; price failed to hold above this after the bounce.
- $81,500 – $82,500: Major resistance; previous consolidation before the major drop.
These levels form the base of our strategy for 9 APRIL BTC Trading 2025.
📈 BUY TRADE IDEA – Long from Support Zone
🔹 Setup: Reversal from Key Support with Bullish Confirmation
BTC found strong support at $75,000 and bounced with bullish momentum. If price retests and forms a bullish candle near this zone, it provides a great buying opportunity.
- Entry: $75,500 (on bullish retest)
- Stop-Loss: $74,000 (below structure)
- Target: $79,500
- Risk-Reward Ratio: 1:3
🧠 Reasoning:
- Price bounced from a demand zone ($75K).
- Bullish engulfing pattern formed near the support.
- Trendline break on the short term suggests strength.
- RSI on LTFs like 15min/1h was oversold earlier and is now neutral, supporting upward movement.
⚠️ Confirmation Required:
Wait for a bullish candle near $75.5K for entry. No entry on sharp red candles—confirmation is key for 9 APRIL BTC Trading 2025 longs.
📉 SELL TRADE IDEA – Short from Resistance Zone
🔹 Setup: Lower High Formation & Resistance Rejection
If BTC pushes toward the $78,800–$79,000 resistance zone and rejects it with bearish candles (like shooting star or engulfing), we may see another leg down.

- Entry: $78,800
- Stop-Loss: $80,000 (above resistance)
- Target: $75,800
- Risk-Reward Ratio: 1:3
🧠 Reasoning:
- Previous price rejection at this zone.
- It’s a former support now acting as resistance (S/R flip).
- Momentum may fade near resistance if volume drops.
- Bearish divergence possible on short TF indicators like MACD.
⚠️ Ideal Entry Signal:
Look for bearish candles or rejection wicks near $78,800 zone before shorting. No blind entries—price action is king.
🧠 Tips for 9 APRIL BTC Trading 2025
- Use Alerts: Set TradingView alerts around key zones like $75.5K and $78.8K to avoid missing out.
- Manage Risk: Never risk more than 1-2% of your capital per trade.
- Watch USDT Dominance: A rise in USDT dominance can signal a BTC pullback.
- Check Volume: Confirm trades with rising volume in your direction—low volume moves can be fakeouts.
🌍 Global Market Sentiment
As of 9 APRIL BTC Trading 2025, global crypto sentiment is mixed:
- BTC dominance is slightly rising.
- Altcoins are consolidating, suggesting capital is flowing back into BTC.
- US inflation news expected midweek could influence Bitcoin’s volatility, so stay tuned.
📌 Conclusion – 9 APRIL BTC Trading 2025 Summary
Bitcoin remains a high-potential asset with tradable volatility. Based on the 1H chart for 9 APRIL BTC Trading 2025, we see two promising setups—a long from the $75,500 zone and a short near $78,800. Support and resistance zones have been respected well historically, offering reliable entry/exit points.
Whether you’re trading breakouts or retests, the key lies in discipline, risk management, and confirmation.
💼 Final Trade Recap – 9 APRIL BTC Trading 2025
| Trade Type | Entry | Stop Loss | Target | R:R Ratio |
|---|---|---|---|---|
| ✅ Buy | $75,500 | $74,000 | $79,500 | 1:3 |
| ❌ Sell | $78,800 | $80,000 | $75,800 | 1:3 |
What is the current trend for Bitcoin on 9 APRIL BTC Trading 2025?
As of 9 APRIL BTC Trading 2025, Bitcoin is showing a short-term recovery after a recent dip. The price is forming a potential higher low near the $75,000 support zone, suggesting bullish momentum may continue if resistance at $78,800 is broken.
What are the key support and resistance zones for BTC on 9 APRIL BTC Trading 2025?
The major support zones for BTC are:
$75,000 – $75,500 (recent bounce area)
$72,500 – $73,000 (strong structural support)
Is it a good time to buy Bitcoin on 9 APRIL BTC Trading 2025?
Yes, a buy opportunity exists near $75,500 if the price retests this level and forms a bullish candle. This setup offers a strong risk-reward ratio of 1:3. However, traders should wait for confirmation before entering.
Should I short BTC near $79,000 today?
Shorting BTC near the $78,800 resistance zone is a valid idea if the price shows bearish rejection patterns like a shooting star or bearish engulfing candle. This is a high-probability trade setup for 9 APRIL BTC Trading 2025 with a target near $75,800.
What indicators should I use for BTC Trading on 9 April 2025?
RSI for overbought/oversold confirmation
Volume to confirm momentum
Price Action patterns (like engulfing or pin bars)
MACD for trend confirmation on higher timeframes