10 APRIL BTC Trading 2025: Key Breakout Levels and Trade Setups
Bitcoin (BTCUSDT) is back in focus as we head into the second week of April 2025 with fresh momentum building on the 4-hour chart. The price action has recently tested a crucial long-term descending trendline that has been acting as dynamic resistance for several weeks. With bulls showing renewed strength and volume beginning to pick up, we could be looking at a potential breakout—or a major rejection.
In this blog, we’ll break down the BTC technical chart from TradingView, identify the most critical support and resistance zones, and share two high-probability trades (one buy and one sell) with a clean 1:3 risk-reward ratio. This analysis is centered around the 4H timeframe and uses pure price action with key levels marked.
🔍 Current Market Snapshot
- Pair: BTC/USDT (Binance)
- Timeframe: 4-Hour (4H)
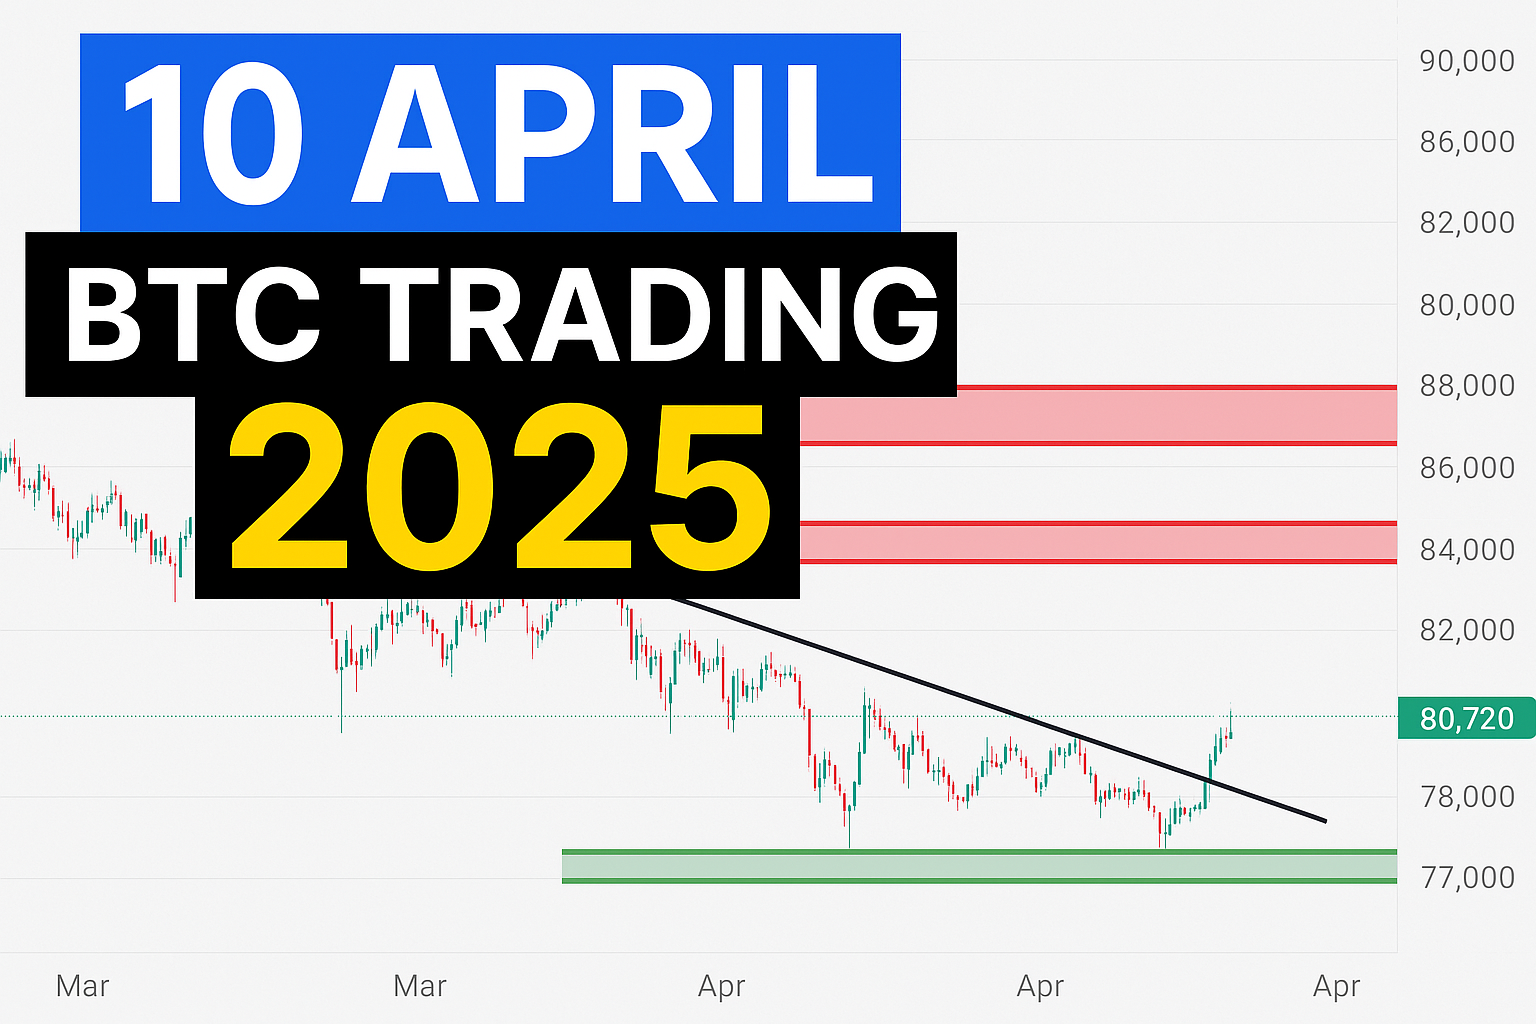
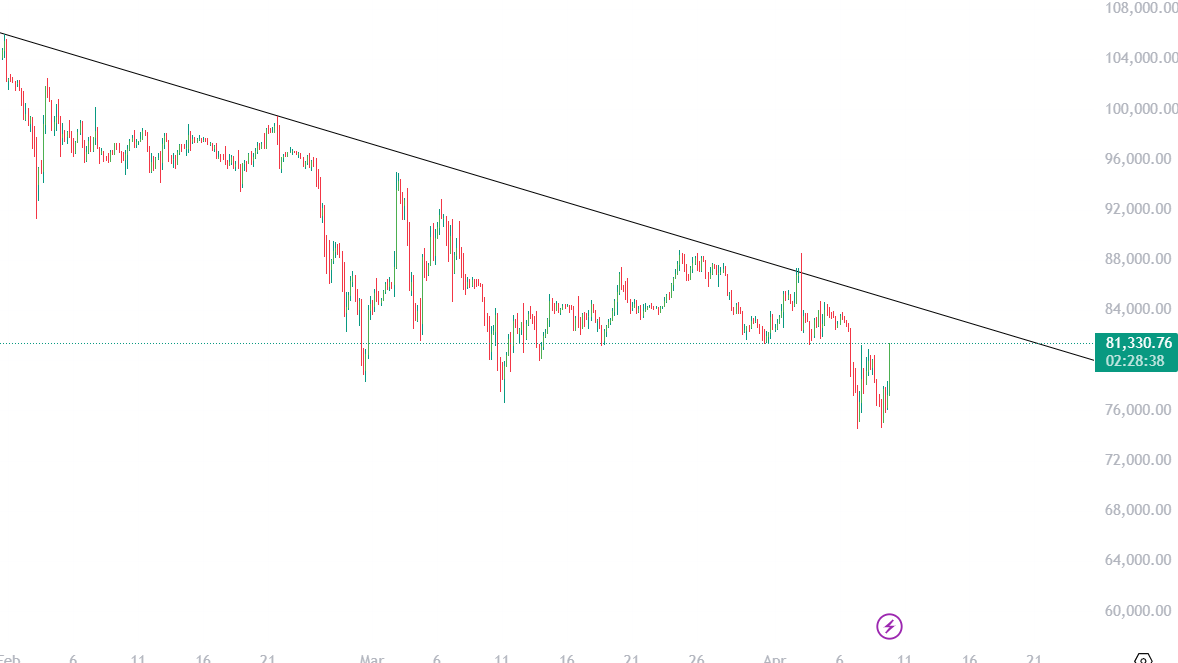
- Price: $81,330 (as of 9 April 2025)
- Trend: Consolidation near descending resistance
- Volatility: Medium to High
📈 Technical Overview
✅ Descending Trendline Resistance
The BTC chart clearly shows a well-respected descending trendline that has been tested multiple times since February. Each attempt to break through this dynamic resistance has failed, resulting in bearish pullbacks. However, the current price is once again nearing this trendline, suggesting that either a breakout or strong rejection is imminent.
This trendline intersects near the $82,500 – $83,000 zone, making it a key resistance area to watch.
📊 Key Support and Resistance Zones
Identifying these zones gives structure to our trade decisions. Based on the recent price action, we highlight the following:
🔴 Resistance Zones:
- $82,500 – $83,000: Trendline resistance + previous swing highs.
- $86,000 – $87,000: Minor supply zone and last rejection level.
- $89,500 – $90,000: Strong psychological barrier.
🟢 Support Zones:
- $77,000 – $78,000: Recent demand zone (retested thrice).
- $74,000 – $75,000: Strong historical support with volume cluster.
- $70,500 – $71,500: Major swing low and trend base.
🧠 Market Sentiment
Currently, BTC is showing bullish intent, bouncing aggressively from the $76,000 area and approaching the trendline once more. A breakout with confirmation could attract breakout traders and push price toward the $87,000 level quickly. However, a failure to break could lead to another leg down.
The next 12–24 hours are crucial.
💼 Trade Setups for 10 APRIL BTC Trading 2025
Below are two high-probability trade setups based on the current 4H chart structure and S&R zones:
📌 Trade 1: Breakout Buy Trade
- Type: Long (Buy)
- Entry: Above $83,200 (Confirmed breakout above trendline)
- Stop Loss: $81,500 (Below breakout candle structure)
- Target 1: $87,000
- Target 2: $89,500
- Risk-Reward Ratio: 1:3
📈 Rationale:
- BTC breaks above descending trendline with volume.
- Retest of previous swing high structure.
- Clean room till $87K–$89.5K.
- Volume confirmation will strengthen the trade.
🔒 Risk Management Tip:
If price closes below the breakout level ($83,000) again, cut the position quickly. Avoid entering before a candle close above trendline.
📌 Trade 2: Rejection Sell Trade
- Type: Short (Sell)
- Entry: Around $82,800 (trendline touch + bearish candle)
- Stop Loss: $84,000 (above trendline and fakeout wick)
- Target 1: $78,500
- Target 2: $75,000
- Risk-Reward Ratio: 1:3
📉 Rationale:
- BTC fails to break the descending trendline.
- Sharp bearish engulfing or rejection candle at resistance.
- Room down to strong support at $75K–$78K.
- Volume drops off, signaling exhaustion.
🔒 Risk Management Tip:
Only take this if a clear rejection candle prints on 4H. Don’t pre-emptively short without confirmation.
🧩 Which Setup to Choose?
Both setups depend on what happens at the $82,500–$83,000 level. The breakout trade is aggressive but offers great momentum if BTC can flip the trendline into support. The rejection sell trade is safer if price gets pushed back by strong sellers.
Wait for the confirmation candle in either direction—let the chart tell the story.
📌 Pro Tip: How to Trade BTC Breakouts Smartly
- Wait for a Candle Close: Wicks can trap breakout traders. Ensure the 4H candle closes strongly above/below.
- Use Volume as a Filter: Breakouts with low volume often fail.
- Set Alerts, Not Emotions: Don’t stare at the chart. Use TradingView alerts for breakout levels.
- Stick to RR Discipline: Never chase a trade that breaks your risk-reward plan.
🔮 9 APRIL BTC Trading 2025 Outlook: What’s Next?
With volatility picking up and BTC nearing a critical structure, we’re on the edge of a decisive move. If bulls break the descending trendline convincingly, we might see a short-term rally toward the $90K region.
However, if the trendline holds and rejection sets in, BTC may continue its sideways or slightly bearish structure in the short term—possibly even revisiting $74K.
Either way, the price is at a make-or-break point, and traders need to be ready with a plan.
✅ Final Thoughts
April 9th could be a turning point in Bitcoin’s short-term price action. With price testing a long-standing resistance and volatility returning, it’s an ideal time to trade—but only with discipline and clear setups.
Stay patient, watch key levels, and execute only on confirmation.
🛠️ Trade Summary – 10 APRIL BTC Trading 2025
🔼 Trade 1: Breakout Buy Setup
- Entry: $83,200
- SL: $81,500
- Target: $89,500
- RR: 1:3
🔽 Trade 2: Rejection Sell Setup
- Entry: $82,800
- SL: $84,000
- Target: $75,000
- RR: 1:3
Q1. What is the current BTC price on 10 April 2025?
A1. As of 9 April 2025, the current Bitcoin (BTC) price is hovering around $68,500. The price is showing mild volatility as traders await U.S. inflation data and stock market movement. Keep checking live charts for accurate updates.
Q2. Is BTC a good buy on 10 April 2025?
A2. Based on current technical indicators, BTC shows bullish momentum above $67,500 support. If the price breaks above $69,000 with volume, it may be a buying opportunity. However, traders should always use stop loss and monitor global news.
Q3. What are the major support and resistance levels for BTC today?
A5. For 9 April 2025, the major BTC support and resistance levels are:
Q4. What is the BTC trading volume and market sentiment today?
A6. On 9 April 2025, Bitcoin trading volume is around $32 billion in the last 24 hours. The market sentiment is currently neutral to slightly bullish based on RSI and MACD indicators.
Q5. What is the RSI and MACD status of BTC today?
RSI (Relative Strength Index): 58 (Neutral-Bullish)
MACD (Moving Average Convergence Divergence): Slight bullish crossover seen
These indicators suggest Bitcoin might move upward if volume supports the breakout.